Seeing organic traffic drop significantly can make even the most level headed marketer feel anxious, especially if you can’t figure out where the change is coming from.
Here are a few steps you can take to identify what happened — so you can quickly address the problem.
Step 1: Figure out when the organic traffic drop occurred.
In order to figure out what happened, you will need to know when it happened.
Sometimes the exact date is clear, like the day you launched your new website.
Other times, you have to get a general feel for the time period where the shift occurred and pick a reasonable date that reflects the “turning point.”
In the analytics chart below, organic traffic started to decline around the end of August, which coincides with the date that the client launched a new website: August 28th.
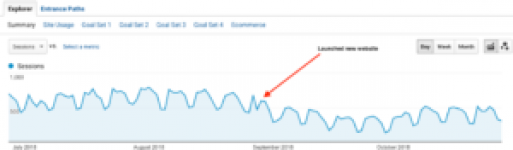
Now that we have a turning point — in this case August 28th — we can do some analysis to figure out what happened.
Step 2: Identify which organic landing pages lost significant traffic.
Fire up your Google Analytics. In the date range section, select your “turning point” date as your start date. Set today as your end date.
Then turn on “Compare to” and select “previous period” from the dropdown beside it. This assumes that you have at least as many days in the comparison period as you have in the date range. If not, adjust the date range so that they two are equally represented.
At the top, turn on the Organic Traffic filter.
Using the menu on the left hand side, select Behavior > Site Content > Landing Pages.
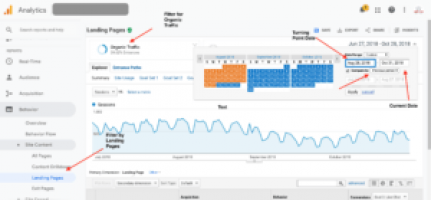
Now export the data to Google Sheets (or Excel if you prefer) using the “EXPORT” button in the top right corner of the page.
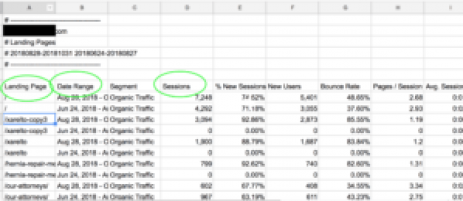
Your spreadsheet should come out looking something like the screenshot below. It’ll have a lot of columns, but the only ones you really need are Column A (Landing Page), Column B (Date Range), and Column D (Sessions).
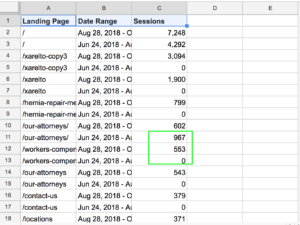
So delete everything else, and it should look more like the screenshot below. This data shows you the number of organic sessions (organic traffic) that each landing page received for two date ranges: Turning point through today, and the previous period (just like we selected in Analytics). These will appear in separate rows.
In the example below, cell C2 reflects organic homepage sessions from the turning point through today and C2 represents organic homepage sessions from the previous period.
Now we can apply some simple formulas to help us quickly identify which pages experienced the largest decreases in traffic.
In Cell D1, put in this formula “=if(A2=A3,C2-C3)” and then drag this formula all the way down Column D, applying to every cell in that column. Essentially, this formula is saying “If the pages are the same (if A2=A3), calculate the difference in sessions between the two date ranges.”
After applying the formula, your spreadsheet should look like this:
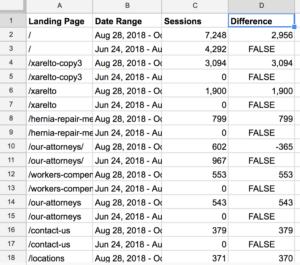
Now, you delete the rows that say “FALSE.” But it’s not as simple as it seems, so pay close attention!
Highlight all of Column D and select “Copy.” Then, select “Edit > Paste > Paste Special > Paste values only.” This removes the formulas associated with these unneeded values.
Now, sort the spreadsheet by Column D (Z→ A) and then delete all the rows that have “FALSE” in Column D.
Your spreadsheet should now look like this:
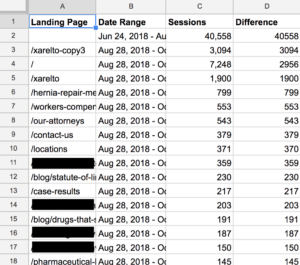
OK! Almost there!! We just need to sort the spreadsheet again by Column D, A → Z. This will bring the “smallest” numbers to the top. In this case, that means our largest negative numbers — the troublemakers we want to find — will rise to the top.
As you can probably tell by now, the negative numbers in Column D represent the loss in organic traffic for that page.
At this point, your spreadsheet will hopefully look like this:
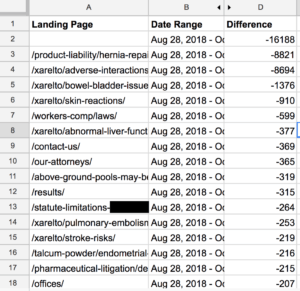
Ta-da! Now you have a list of every page that lost organic traffic, prioritized by the size of the loss. This should serve as your roadmap as you work to solve your website’s issues in a thoughtful way.
Step 3: Review each landing page to uncover what happened.
For each page, identify the problem and make a plan to solve.
Problems might include:
- Broken links
- Missing pages
- Missing 301 redirects
- Drop in keyword ranking for keywords associated with page
Once you see the problem, you can address it.
We hope this article has been valuable for you! If you have questions about your organic traffic or anything else SEO related, feel free to drop us a line! We’re happy to help.